In 2026, the American financial landscape is defined by a "K-shaped" recovery. While asset owners are seeing record highs in the S&P 500, a significant portion of the population is trapped in a debt-anchor cycle. Debt doesn't just take your money today; it steals the "financial machinery" required to build wealth tomorrow.
1. The 2026 Debt Landscape: By the Numbers
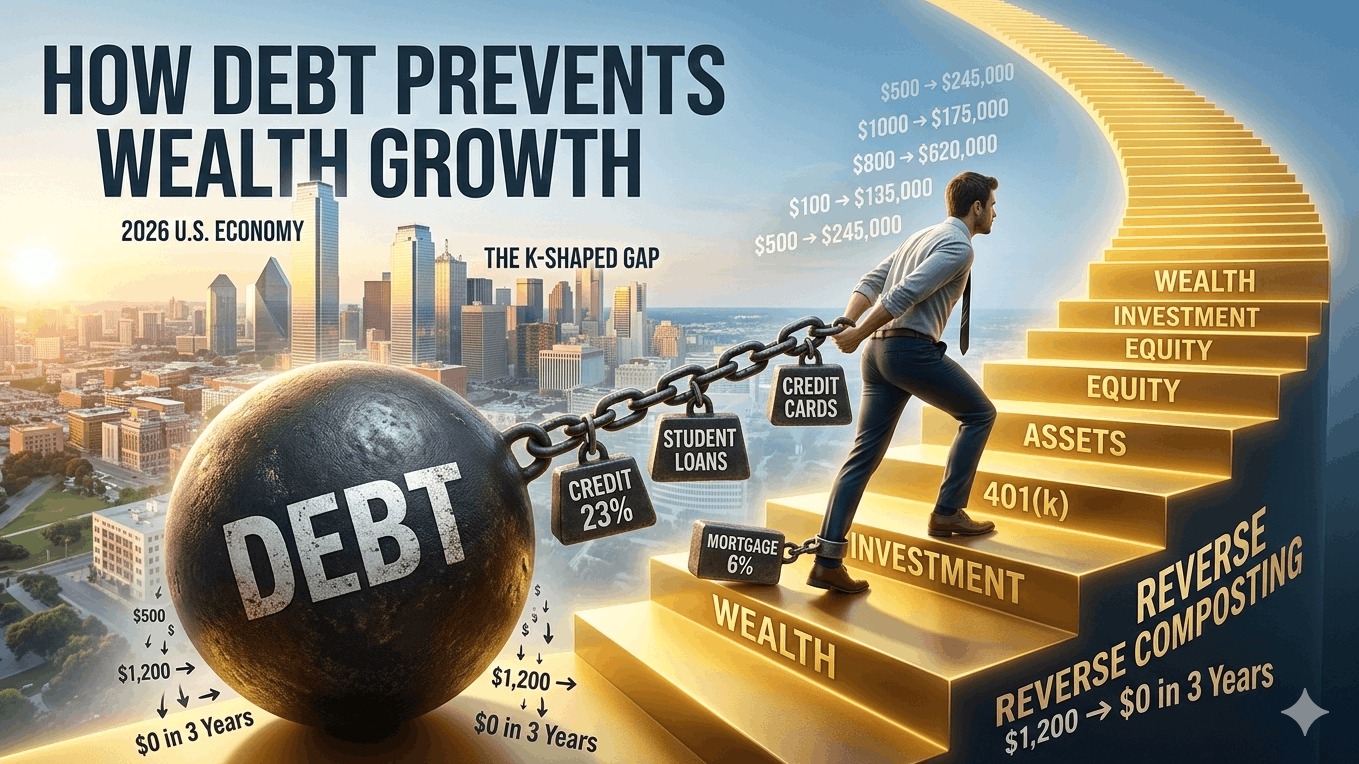
As of early 2026, U.S. household debt has climbed to $18.8 trillion. The burden is no longer just about the principal; it’s about the cost of carrying it in a higher-interest environment.
| Debt Type | 2026 Total (Est.) | Average Interest Rate | Impact on Wealth |
|---|---|---|---|
| Credit Cards | $1.28 Trillion | 21–24% | Destroys compounding; creates a "guaranteed" negative return. |
| Mortgages | $13.17 Trillion | 6.0–6.5% | Provides leverage but consumes 30%+ of monthly cash flow. |
| Student Loans | $1.66 Trillion | 5–8% | Delays first-home purchases by an average of 7–10 years. |
| Auto Loans | $1.67 Trillion | 8–12% | Financing a depreciating asset is the #1 wealth-killer for the middle class. |
2. How Debt Acts as a "Wealth Anchor"
Debt prevents growth through three primary mechanisms: Interest Erosion, Opportunity Cost, and Psychological Risk Aversion.
A. The Reverse Compounding Effect
Wealth building relies on the formula $A = P(1 + r)t. Debt uses the exact same math against you. At a 23% credit card APR, your debt doubles every 3.1 years. This "reverse compounding" creates a hole that is mathematically impossible to out-invest with a standard portfolio earning 8–10%.
B. The Death of Opportunity Cost
Every dollar sent to a creditor in 2026 is a dollar that cannot be placed into a tax-advantaged 401(k) or a Roth IRA.
- Example: A $500 monthly car payment over 5 years costs **$30,000** in cash.
- The Real Cost: If that $500 had been invested in an index fund at 8%, it would be worth **~$36,500** after 5 years and ~$245,000 after 30 years. That car didn't cost $30k; it cost you a quarter-million dollars of retirement wealth.
C. The "K-Shaped" Mobility Gap
In 2026, debt-free households are using high interest rates to earn 5% yields on cash. Meanwhile, households with debt are paying 20%+ to those same banks. Debt effectively transfers wealth from the bottom 80% to the top 20%, widening the inequality gap.
Quotes & Taglines
- "Debt is the interest paid on an ego you can't afford."
- "You cannot sail toward wealth while your anchor is stuck in the mud of past consumption."
- "In 2026, the best investment return is the 23% you save by killing your credit card balance."
- "Debt-free is the new 'Rich'."
- "Borrowing from your future self is a loan you can never refinance."