If you spend even a little time reading about investing, you’ll eventually come across the term “P/E ratio.” It’s one of the most widely used financial metrics in the stock market, and for good reason.
The Price-to-Earnings ratio helps investors answer a very important question:
“Is this stock expensive or reasonably priced?”
At its core, the P/E ratio compares a company’s stock price to its earnings. Investors use it to evaluate how much they are paying for every dollar of profit the company generates.
Simple idea. Huge importance.
But while the formula itself is easy, understanding how to properly use the P/E ratio takes a little more context.
What Is the Price-to-Earnings Ratio?
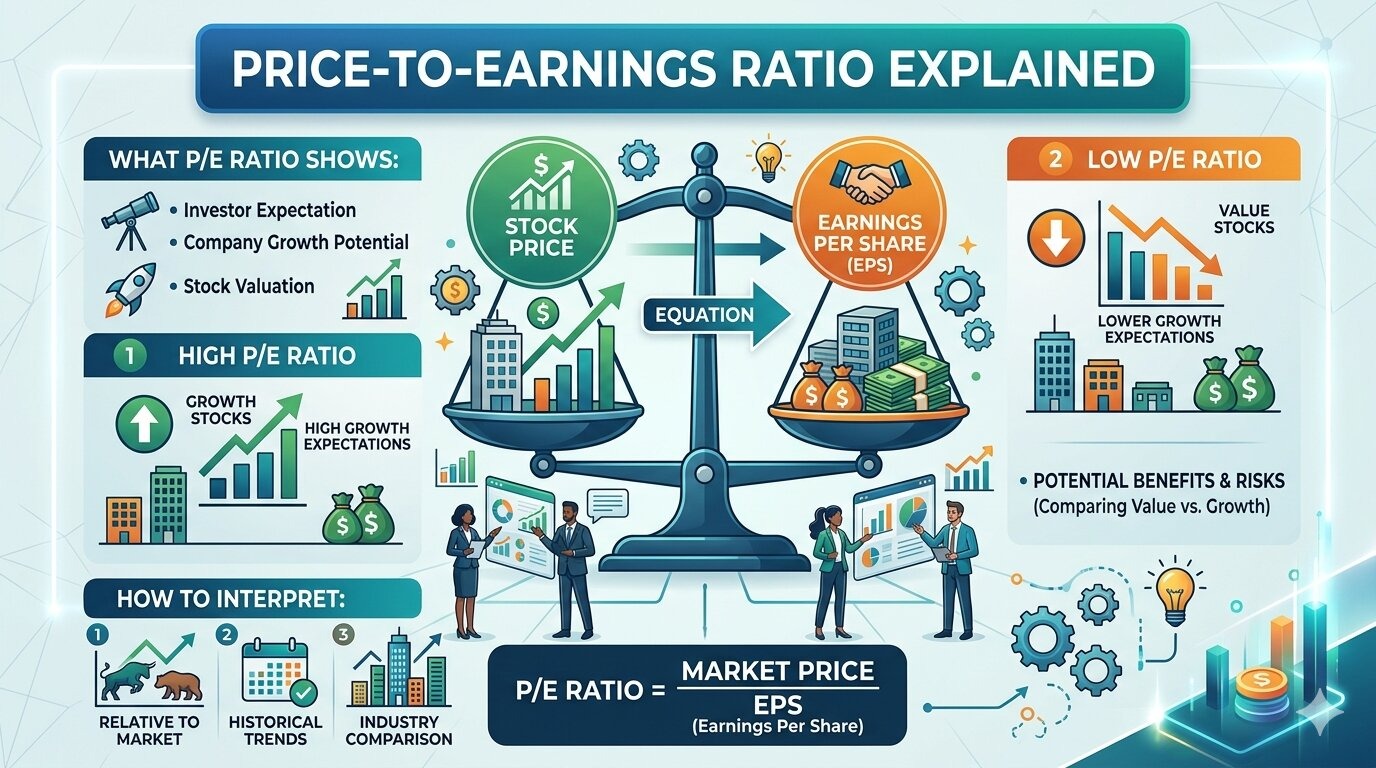
The Price-to-Earnings ratio, usually called the P/E ratio, measures the relationship between a company’s share price and its earnings per share (EPS).
The formula looks like this:
P/E Ratio = Share Price / Earnings Per Share
For example:
- Company stock price = $100
- Earnings per share = $5
The calculation becomes:
P/E Ratio = 100 / 5 = 20
That means investors are willing to pay $20 for every $1 of earnings.
Why the P/E Ratio Matters
The P/E ratio helps investors compare stock valuations more easily.
Instead of simply looking at stock prices alone, investors can evaluate whether a company’s earnings justify its current price.
For example:
- A $20 stock may actually be expensive
- A $300 stock may actually be cheap
The stock price itself means very little without context.
The P/E ratio provides that context.
Understanding High vs Low P/E Ratios
One of the biggest beginner mistakes is assuming a low P/E ratio always means a stock is cheap or a high P/E ratio always means a stock is overpriced.
It’s not that simple.
High P/E Ratio
A high P/E ratio often means investors expect strong future growth.
Companies with rapidly growing revenue and profits usually trade at higher valuations because investors believe earnings will increase significantly over time.
Examples often include:
- Technology companies
- AI businesses
- Fast-growing software firms
Investors are essentially paying a premium for future potential.
Low P/E Ratio
A low P/E ratio may indicate:
- An undervalued stock
- Slower growth expectations
- Industry challenges
- Financial concerns
Sometimes a stock trades cheaply because investors expect future problems.
This is why blindly buying low-P/E stocks can be risky.
Simple Comparison Example
| Company | Stock Price | EPS | P/E Ratio |
|---|---|---|---|
| Company A | $120 | $6 | 20 |
| Company B | $120 | $3 | 40 |
Even though both stocks cost the same, Company B is valued much more aggressively relative to earnings.
Investors are paying twice as much for each dollar of Company B’s profits.
Types of P/E Ratios
There are actually multiple versions of the P/E ratio.
Trailing P/E
Trailing P/E uses earnings from the past 12 months.
This is based on actual reported profits.
Forward P/E
Forward P/E uses projected future earnings.
This version depends on analyst estimates and future expectations.
Forward P/E can sometimes look lower if investors expect earnings growth next year.
Industry Differences Matter
One of the most important rules when using the P/E ratio:
Always compare companies within the same industry.
Different industries naturally trade at different valuation levels.
For example:
| Industry | Typical P/E Range |
|---|---|
| Technology | Higher |
| Utilities | Lower |
| Consumer Staples | Moderate |
| High-Growth Startups | Very High |
A tech company with a P/E ratio of 35 might be completely normal, while a utility company with the same ratio could look extremely expensive.
Context matters more than the raw number itself.
What Is Considered a “Good” P/E Ratio?
There’s no universal perfect number.
That said, many investors roughly view:
- Under 15 as potentially low
- Around 15–25 as moderate
- Above 25 as relatively high
But again, these numbers vary heavily depending on:
- Industry
- Interest rates
- Economic conditions
- Company growth
- Investor sentiment
During periods of strong economic optimism, investors often accept higher P/E ratios across the market.
During recessions or market fear, P/E ratios usually shrink.
The Relationship Between Growth and P/E
Companies growing earnings quickly often justify higher valuations.
Imagine two businesses:
Company A
- Earnings growth: 3% annually
- Stable mature business
Company B
- Earnings growth: 25% annually
- Expanding rapidly
Investors are usually willing to pay a higher P/E ratio for Company B because future earnings may increase much faster.
This is why growth stocks often look “expensive” compared to traditional value stocks.
Limitations of the P/E Ratio
The P/E ratio is useful, but it definitely has weaknesses.
It Does Not Work Well for Unprofitable Companies
If a company has negative earnings, the P/E ratio becomes meaningless.
Many startup or early-stage growth companies fall into this category.
Earnings Can Be Manipulated
Accounting adjustments can temporarily inflate earnings.
That’s why experienced investors also examine:
- Cash flow
- Debt
- Revenue trends
- Operating margins
Financial analysis should never rely on only one metric.
You can learn more about broader company evaluation in How to Evaluate Company Financial Statements.
P/E Ratios Ignore Debt
Two companies may have identical earnings but completely different debt levels.
A heavily indebted business may carry much higher financial risk despite a low P/E ratio.
P/E Ratio vs PEG Ratio
Some investors prefer using the PEG ratio, which adjusts the P/E ratio based on earnings growth.
The formula looks like this:
PEG Ratio = P/E Ratio / Earnings Growth Rate
This helps investors determine whether growth justifies a company’s valuation.
For example:
- High P/E with high growth may still be reasonable
- High P/E with slow growth may look overpriced
Real-World Example
Think about major technology companies during rapid innovation periods.
Many investors criticized them for having high P/E ratios years ago. But some of those businesses continued growing earnings so quickly that their valuations eventually became more reasonable over time.
At the same time, there are also examples of companies with extremely high P/E ratios that later collapsed because growth expectations became unrealistic.
That’s why the P/E ratio should always be used alongside common sense and broader business analysis.
How Investors Actually Use the P/E Ratio
Most experienced investors use the P/E ratio as a starting point, not a final answer.
Here’s a typical process:
Step 1: Compare Industry Peers
Check whether the company trades above or below competitors.
Step 2: Examine Growth Trends
A higher valuation may be justified if earnings are growing rapidly.
Step 3: Review Financial Health
Look at:
- Debt levels
- Cash flow
- Profit margins
- Revenue stability
Step 4: Evaluate Future Risks
Consider:
- Competition
- Regulation
- Economic slowdown
- Technological disruption
Practical Tips for Beginners
Don’t Obsess Over One Number
Investing is rarely that simple.
A stock with a P/E ratio of 12 is not automatically better than one trading at 30.
Avoid Extreme Valuations Without Strong Reasons
Very high P/E ratios often require near-perfect future growth expectations.
That can create risk if growth slows.
Combine P/E With Other Metrics
Use additional measures like:
- Debt-to-equity
- Profit margins
- Return on equity
- Free cash flow
Think Long Term
Short-term market movements can distort valuations temporarily.
Long-term business quality matters more.
This idea also connects closely with strategies discussed in Passive vs Active Investing Strategies and How to Reduce Investment Risk.
Common Beginner Misunderstandings
“Low P/E Means Cheap”
Not always.
Sometimes the market expects declining profits or business problems.
“High P/E Means Bad”
Also not true.
Many excellent growth companies trade at high valuations for years.
“The Market Always Prices Stocks Correctly”
Markets can become overly optimistic or overly pessimistic.
That’s why valuation analysis matters in the first place.
Final Thoughts
The Price-to-Earnings ratio remains one of the most popular investing metrics because it offers a quick way to evaluate stock valuation relative to earnings.
But the real power of the P/E ratio comes from understanding the story behind the number.
A high P/E ratio may reflect optimism and future growth potential. A low P/E ratio may signal value — or warning signs. The ratio itself is only the beginning of the analysis.
The best investors use the P/E ratio alongside broader financial research, industry comparisons, and long-term business understanding.
And honestly, once you understand how the P/E ratio works, stock prices start making a lot more sense. You stop looking only at the price tag and start thinking more like a business owner instead of a trader chasing headlines.